Glycemic Forecaster: Predicting Glycemic Response from CGM Data and Food Logs
In this project, I explored the relationship between diet, exercise, and personal glycemic response using acquired Continuous Glucose Monitor (CGM) data acquired with a Freestyle Libre device. The goal was to build a model that could predict glucose spikes based on meal composition and other factors, providing a framework for personalized nutrition insights.
Motivation
The potential of personalized nutrition is immense, and the rich data from CGMs can offer powerful insights. This project is also personal - as someone diagnosed with pre-diabetes, I wanted to move beyond the limitations of the A1C test – a lagging three month average of blood glucose levels – to understand the immediate, real-time impact of my lifestyle choices on my glucose levels.
To do this, I sought to replicate and adapt methodologies from key scientific papers, aiming to turn my raw glucose readings into actionable insights. The result is not only insights on my own glucose data but also a reusable tool I developed to empower clinicians and patients apply these same methodologies to their own data.
Data & Initial Processing
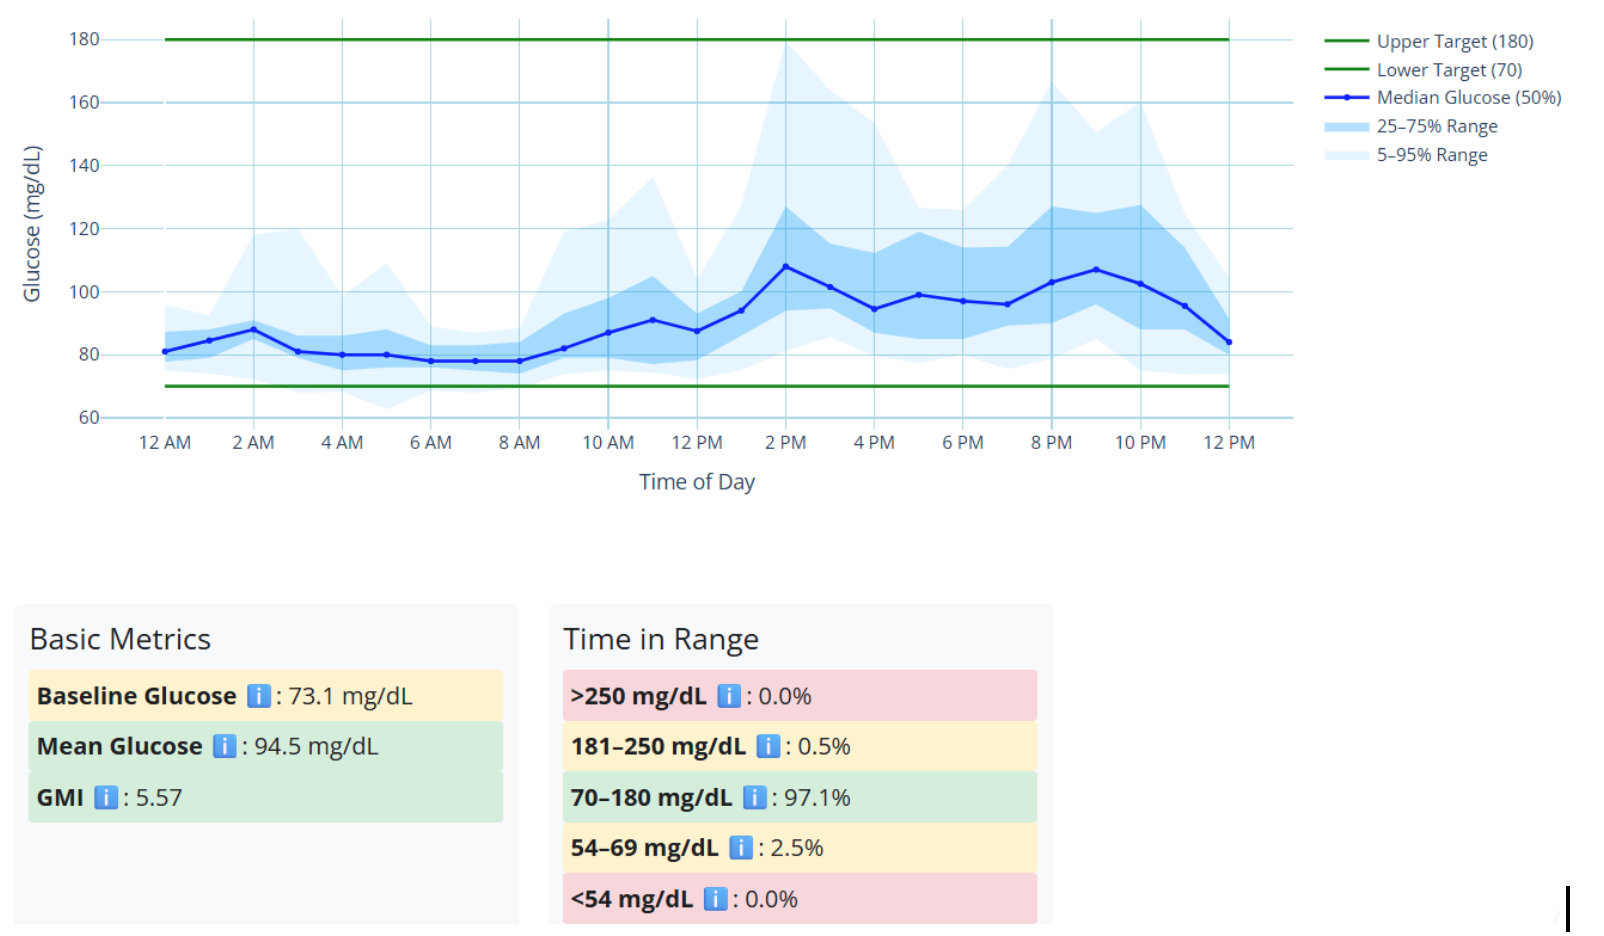
The analysis is based on two primary data sources - CGM glucose data and time-stamped meal and exercise logs. The entire data contains a total of 94 meal logs. My first step was to establish a comprehensive overview of the user’s glucose profile. This involved summarizing the aggregated data over a 10-14 day CGM wear period, displaying the Ambulatory Glucose Profile (AGP) to visualize the median glucose levels and variability throughout the day. I then calculated key metrics, including Mean Glucose, Baseline Glucose, Glucose Management Index (GMI)[1], an estimate of A1C, as well as Time spent in ranges[2]. This process mirrored the standard reports generated by devices like the Freestyle Libre, using recommendations from the American Diabetes Association.
Feature Engineering: From Meals to Model Inputs
The project aimed to model how specific meals impacted glucose levels. This required matching user-logged meals to their corresponding glucose peaks and generating meaningful features.
Linking Meals to Glucose Peaks
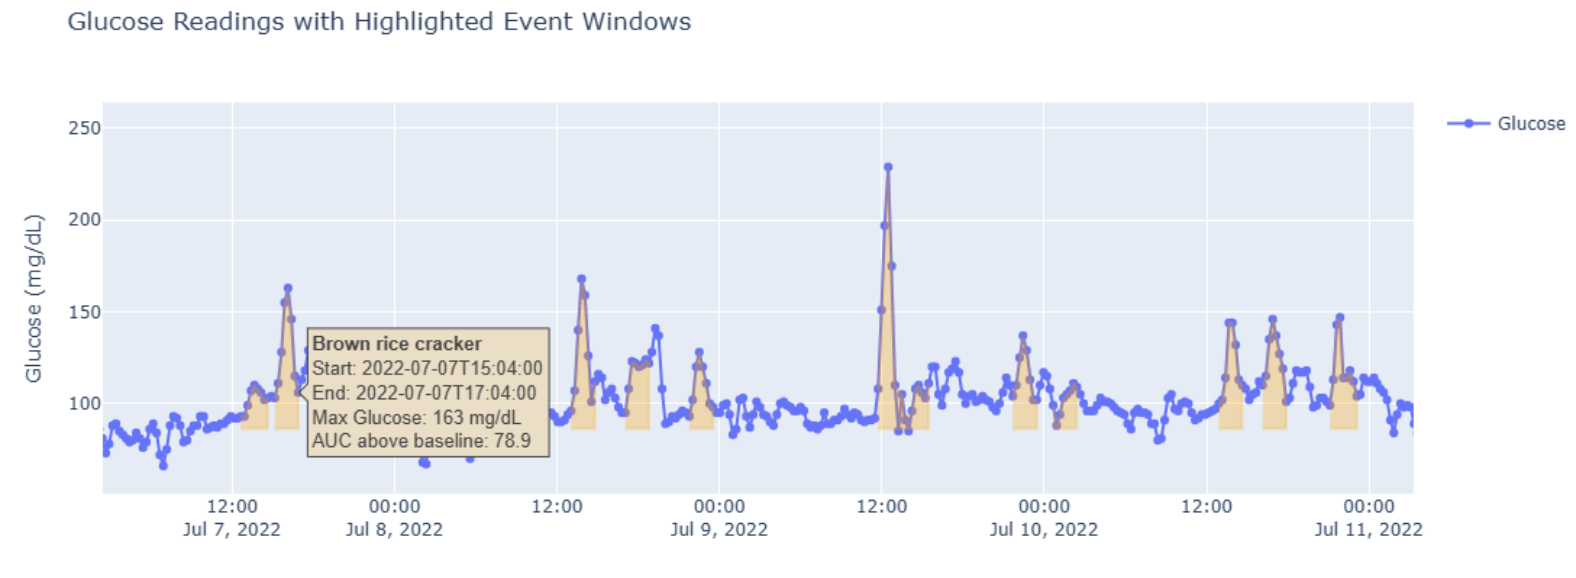
I matched each user-logged meal to a subsequent glucose peak. To do this, I created a two-hour event windows starting from the time of the logged meal, which assumes that the user logs their food at the beginning of the meal. This allowed me to isolate the glycemic response for each specific food intake. The resulting event windows were visually checked against the observed peaks to ensure accuracy. #Code Snippet
Key Challenges in Meal-to-Peak Matching
- Overlapping Meal Events - When meals were eaten in quick succession, their two-hour event windows would overlap, making it impossible to isolate the glycemic impact of a single meal. To ensure the integrity of the analysis, any meal log that occurred within two hours of a preceding one was considered “contaminated” and excluded from the model training set.
- Mismatched and Missing Data - This is a tricky one - we shouldnt expect a 1:1 match between logs and peaks due to imperfect user logs, delayed response due to biology, etc. We observed some significant glucose peaks without corresponding meal logs. These “unexplained peaks” were excluded from the meal-based analysis. Occasionally, meal logs without corresponding peak were found in the event window. In these cases, the data was manually reviewed to see if the log could be matched with a plausible nearby peak (e.g., a peak that occurred slightly before the log was entered). It’s a good reminder how messy real world data can be.
- Sensor Malfunctions - Continuous Glucose Monitors can sometimes produce erroneous readings, especially near the end of their 10-14 day lifespan. One dataset showed clear signs of sensor malfunction in the final days, with erratic and physiologically implausible readings (blood glucose over 200+ mg/dL for 3 days??). This required trimming the dataset to remove the faulty data before proceeding with the analysis.
Using LLMs for Macronutrient Extraction
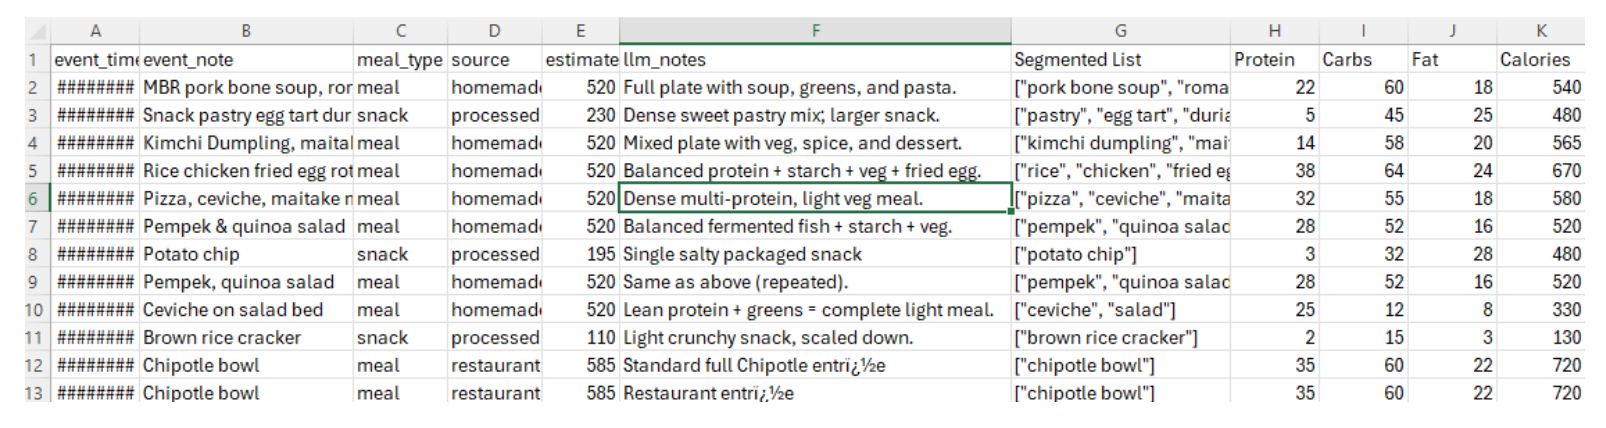
A major challenge was converting unstructured, free-text food logs (e.g., “Chipotle bowl”) into structured, analyzable data. I developed an LLM-based workflow to parse these logs and estimate macronutrients. This workflow involved four key steps:
- Meal Classification: The LLM inferred the meal type (meal, snack, drink) and source (homemade, restaurant).
- Segmentation: It broke down composite meals into individual components (e.g., “pork bone soup” -> “pork bone”, “soup”, “greens”). #Change this example
- Portion Allocation: The LLM assigned weights to each component. #Elaborate
- Macronutrient Estimation: Finally, it estimated the protein, carbohydrates, fat, and calories for each component and the entire meal, using nutritional databases like USDA where possible.
This process effectively transformed messy text logs into a clean, structured dataset ready for modeling. The outputs were cross-verified where possible with published nutritional information for items like a Chipotle bowl or packaged snacks.
Key Challenges encountered:
- Handling Missing Portion Sizes: A common issue with self-reported data is the lack of explicit portion sizes. My workflow addressed this by first using the LLM to classify the meal type (e.g., snack vs. dinner), which helped infer reasonable portion sizes.
- Standardizing Mixed-Format Entries: User logs were inconsistent; some listed individual ingredients while others named a composite meal. The segmentation step was crucial for standardizing this data by breaking down meals like a “chipotle chicken burrito” into their constituent parts. #Change example, or a least match with photo
- Ensuring Traceability and Quality: To build trust in the LLM’s outputs, I designed the workflow to save its intermediate steps. This created a traceable audit trail, from segmentation to portion allocation to final macronutrient estimates, which served as a guardrail for data quality.
Calculating Peak Features
For each meal-related glucose peak, I calculated several quantitative features to describe its shape and size:
- Glucose Max: The highest point of the peak.
- Area Under the Curve (AUC): Calculated as np.trapezoid(max(glucose - baseline, 0)), this captures the total glycemic impact of the meal.
- Rate of Rise/Fall: The initial slope of the glucose increase and subsequent decrease, which reflects the speed of absorption and insulin feedback. #Code snippet?
Modeling the Glycemic Response
With the features engineered, I set out to model the post-meal glucose response. I focused on two target variables: Glucose AUC and Glucose Rate of Rise.
Model 1: Predicting Glucose AUC
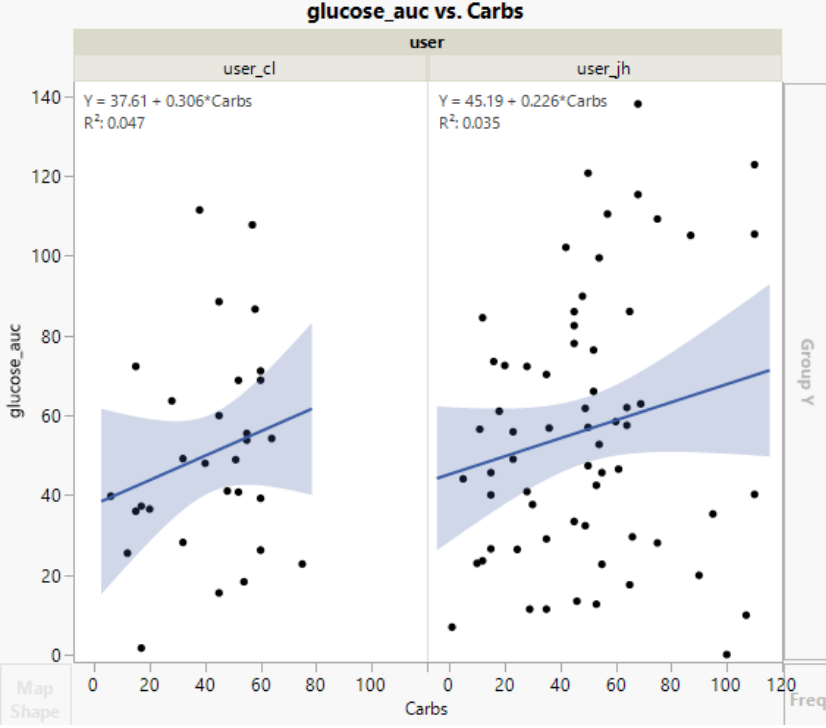
I started with a simple linear regression model predicting glucose AUC based off only carbs. While this showed a positive association for each user, the model explained very little of the variance (low R2 value), indicating that other factors were at play.
I then built slightly more complex model predicting glucose auc based off a few factors including macronutrients, exercise within 3 hours of the meal, and mealtime category (e.g., morning, afternoon). After removing multicollinear features (keep carbs, remove calories and total weight) and simplifying interaction terms to prevent overfitting, I arrived at a more interpretable model.
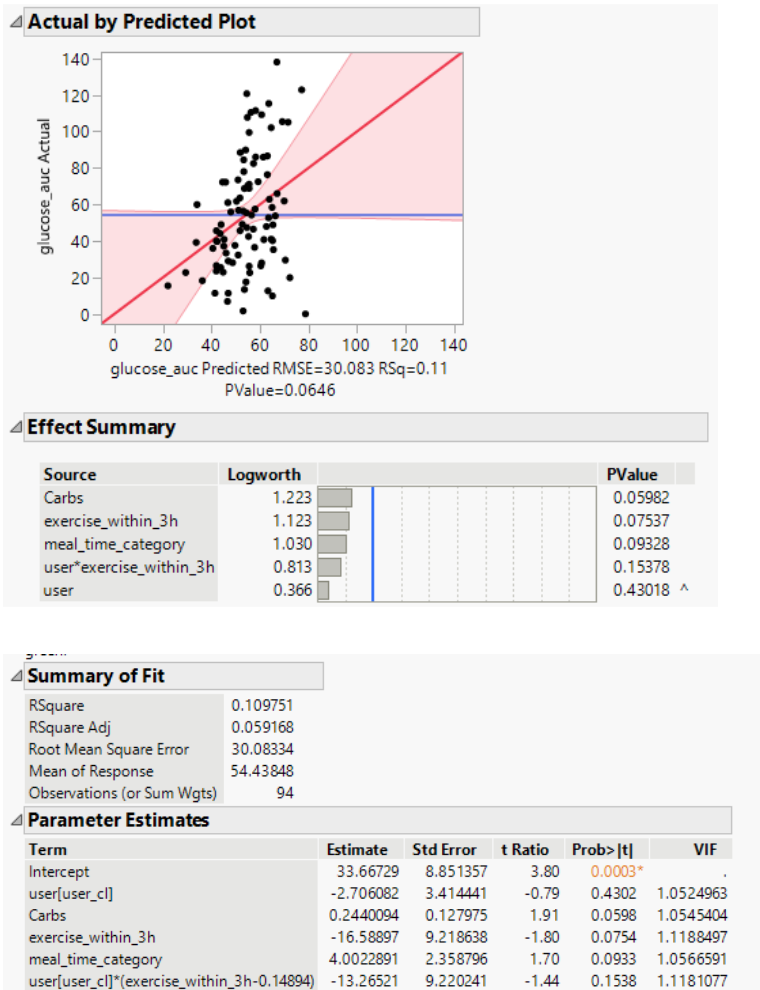
This model explained about 11% of the variance (R2≈0.11), which, while modest, is not unexpected given the inherent noise and complexity of biological data. The key takeaways were:
- Carbohydrates had a positive association with glucose AUC.
- Exercise within 3 hours of a meal had a negative association, tending to reduce the peak size.
- Carbs, exercise, and meal time all showed borderline statistical significance (p≈0.06–0.09), suggesting they are modest but meaningful contributors.
I also experimented with a Random Forest model to capture potential non-linear relationships, but it was sensitive to train/test splits and did not perform better than the linear regression. #Why dont we do train test splits with linera regression?
Model 2: Predicting Glucose Rate of Rise
Another peak metric we calculated is rate of rise. I then built a model predicting glucose rate of rise based off available factors
The plot shows a clear positive trend, but the scatter highlights the high natural variability in glycemic response not captured by the model’s features, which is somewhat expected in this case.
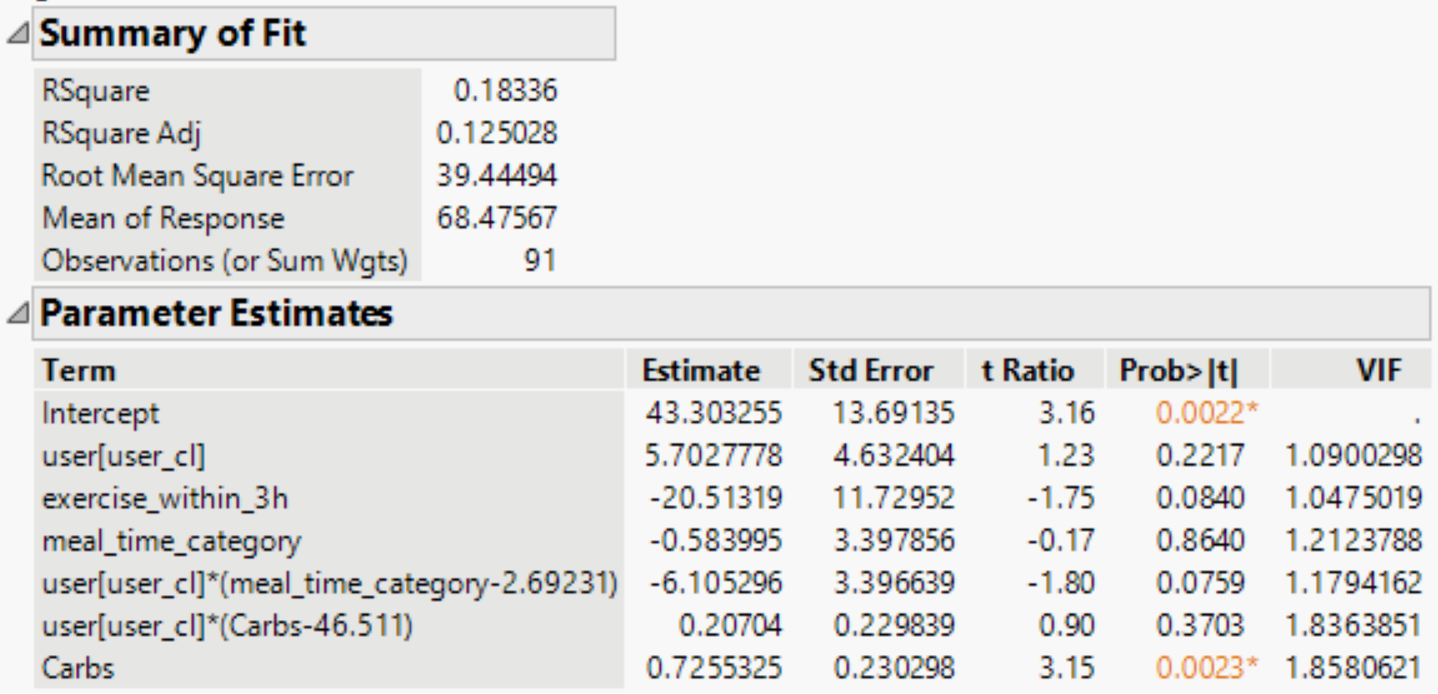
This model performed significantly better, explaining ~18.3% of the variance (R2≈0.183). The results were more definitive:
- Carbohydrates showed a statistically significant positive association with the rate of rise (p=0.002).
- Exercise again showed a marginal negative association (p≈0.084), reinforcing its role in dampening glycemic response.
This suggests that while the total size of a glucose peak (AUC) is complex and affected by many downstream factors, the initial speed of the glucose spike is more directly and predictably tied to the carbohydrate content of a meal.
Summary and Future Value
This project successfully demonstrates an end-to-end pipeline for analyzing CGM and food log data to extract personalized insights. I processed raw data, engineered features from unstructured text using an LLM, and built regression models to understand the drivers of glycemic response.
My model explained ~18% of the variance in glucose rate-of-rise, a promising result that is in line with heavily-cited studies in the field. For reference, an 800 person study[4] reported an R2 of 0.144 for their carbohydrates-only to glucose auc model. That same study eventually achieved a R2 of 0.49 after incorporating a vast array of additional features—including blood tests and microbiome data which suggests a potential upper limit for predictability with more comprehensive datasets.
While a LLM is not a substitute for precise food logging, it reflects the practical reality that most people cannot weigh and measure their macronutrients for every meal. Acknowledging these limitations, the workflow was designed for maximum transparency, with traceable intermediate outputs to ensure the LLM’s logic could be followed and validated. The key findings confirmed that carbohydrates are a significant driver of glucose spikes, while exercise can help mitigate them. Furthermore, modeling the rate of rise proved to be more effective than modeling the total AUC.
Potential Applications
With more data and refinement, this modeling approach could lead to several high-value features and applications:
- Personalized User Tools: Develop a “carb sensitivity” score, allow users to compare meal impacts, and provide actionable feedback on meal timing and composition. This could include recommendations like, “A 20-minute walk within an hour of this meal is likely to reduce the glucose spike”.
- Clinical & Research Applications: Use glycemic variability metrics to help stratify pre-diabetic risk, monitor dietary program adherence, and provide anonymized, aggregate data to nutrition researchers.
Tools Used:
- Python
- pandas
- scikit-learn
- JMP
- plotly
References
- Glucose Management Indicator (GMI): A New Term for Estimating A1C From Continuous Glucose Monitoring, Bergenstal et Al. 2018.
- Clinical Targets for Continuous Glucose Monitoring Data Interpretation: Recommendations From the International Consensus on Time in Range, ADA. 2019.
- Statistical Tools to Analyze Continuous Glucose Monitor Data, William Clarke, M.D. and Boris Kovatchev, Ph.D. 2008.
- Personalized Nutrition by Prediction of Glycemic Responses, Zeevi et al